Differential Gene Expression Analysis: A Beginner-Friendly DESeq2 Tutorial in R
June 25, 2026
Differential gene expression analysis is one of the most common applications of RNA-seq, helping researchers identify genes that are significantly upregulated or downregulated between experimental conditions.
What is DESeq2?
DESeq2 is a popular Bioconductor package in R that analyzes RNA-seq count data and identifies differentially expressed genes using robust statistical methods. It is widely used in research due to its accuracy, reliability, and ease of use.
Simple DESeq2 Workflow
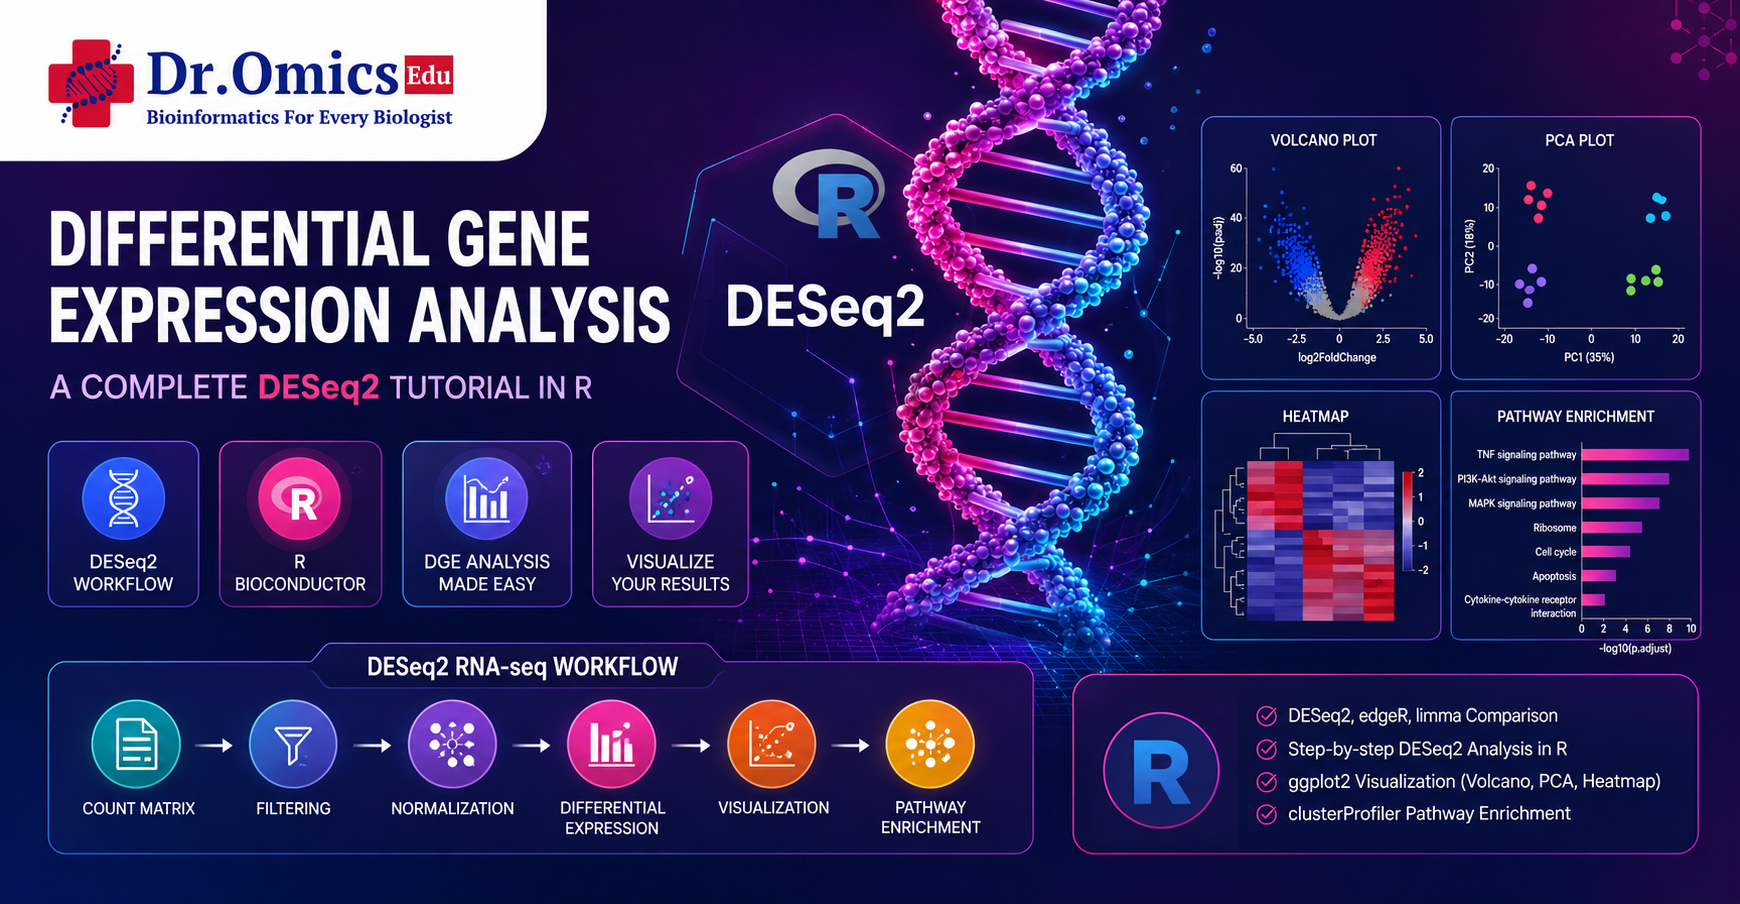
A typical RNA-seq DESeq2 workflow includes:
- Importing the count matrix and sample metadata
- Performing count matrix normalization
- Running differential expression analysis
- Identifying significant genes
- Visualizing results using PCA plots, heatmaps, and volcano plots
- Performing pathway enrichment analysis
Key Visualizations
PCA Plot
A PCA plot helps assess sample clustering and identify potential outliers.
Volcano Plot
Using ggplot2, volcano plots display significantly upregulated and downregulated genes in a clear and intuitive way.
Heatmap
A DESeq2 heatmap visualizes expression patterns across samples and highlights genes with similar behavior.
Beyond Differential Expression
After identifying significant genes, researchers often perform pathway enrichment analysis using tools such as clusterProfiler to uncover affected biological pathways and processes.
DESeq2 vs edgeR vs limma
While DESeq2, edgeR, and limma are all popular RNA-seq analysis tools, DESeq2 is often the preferred choice for beginners because of its user-friendly workflow and strong statistical performance.
Final Thoughts
If you're new to RNA-seq analysis, DESeq2 is an excellent starting point. By learning normalization, differential expression testing, PCA plots, heatmaps, volcano plots, and pathway enrichment, you'll build a strong foundation for modern transcriptomics and bioinformatics research.
